
Introduction
Data transformation is a crucial task for data analysts, enabling the extraction of valuable insights from raw data. One essential aspect of data transformation in Power BI is grouping data. This guide will explore how to group data in Power BI using the Power Query Editor, with practical examples and script snippets, tailored for data analysts.
What is Grouping Data?
Grouping data involves aggregating data points based on a common field to summarize and analyze the dataset more effectively. For example, grouping sales data by month or product category can help in identifying trends and making data-driven decisions.
Importance of Grouping Data
Grouping data allows data analysts to:
- Summarize large datasets for easier analysis.
- Identify patterns and trends in the data.
- Perform aggregate calculations, such as sums, averages, counts, etc.
Step-by-Step Process for Grouping Data in Power BI
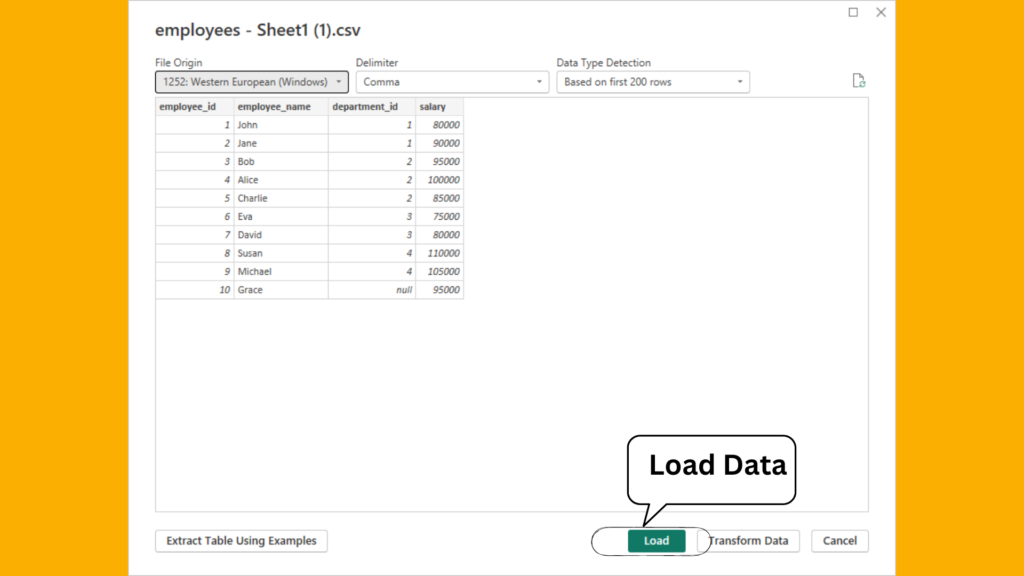
1. Loading Data into Power BI
Begin by loading your dataset into Power BI. You can import data from various sources such as Excel, SQL databases, and web data.
1. Open Power BI Desktop.
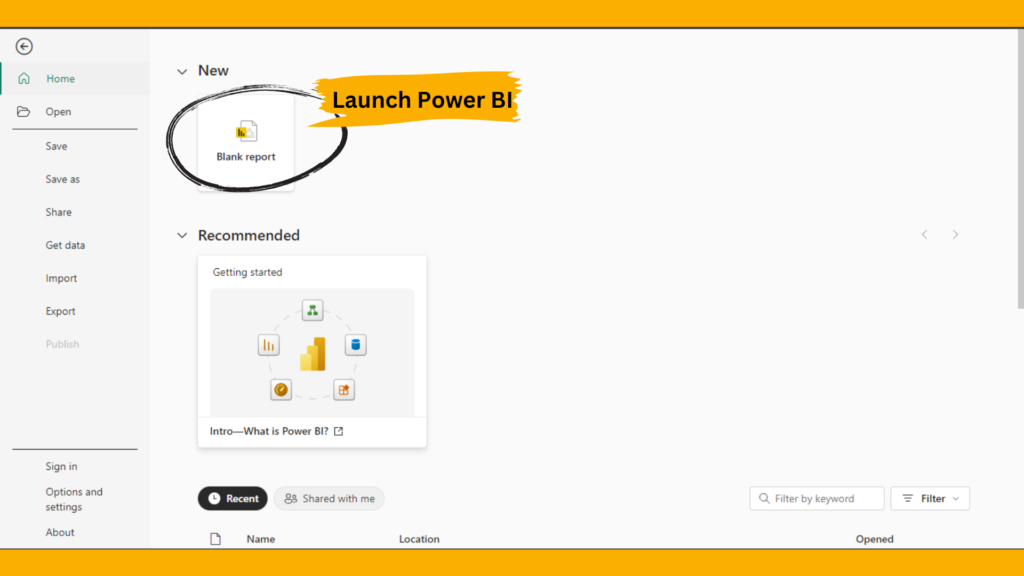
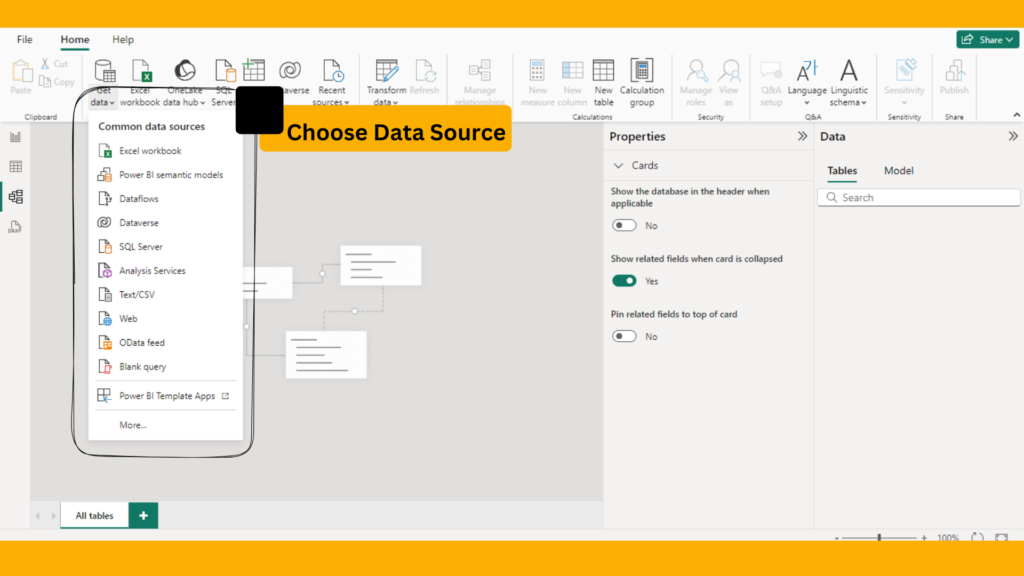
2. Click on Get Data from the Home ribbon.
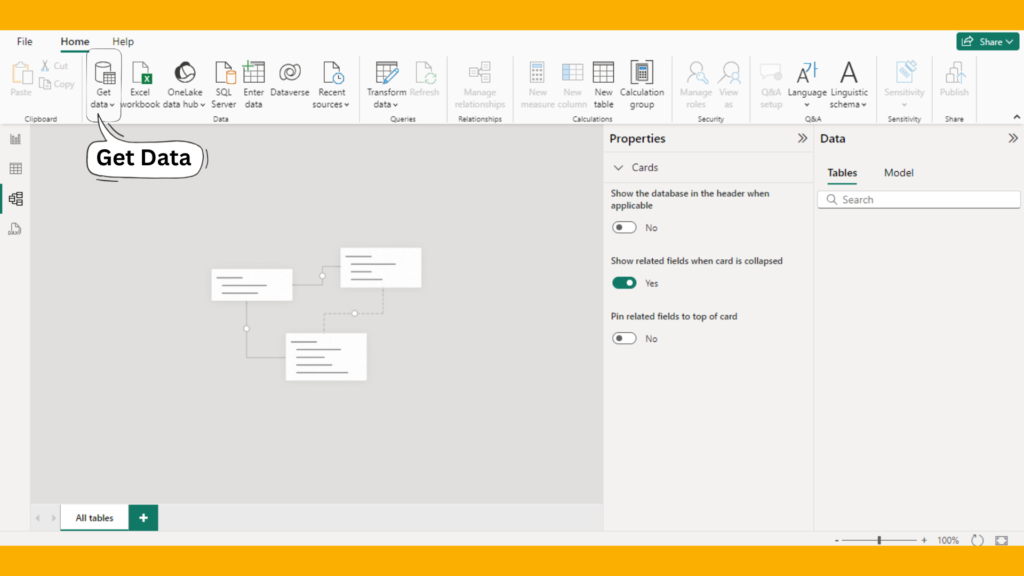
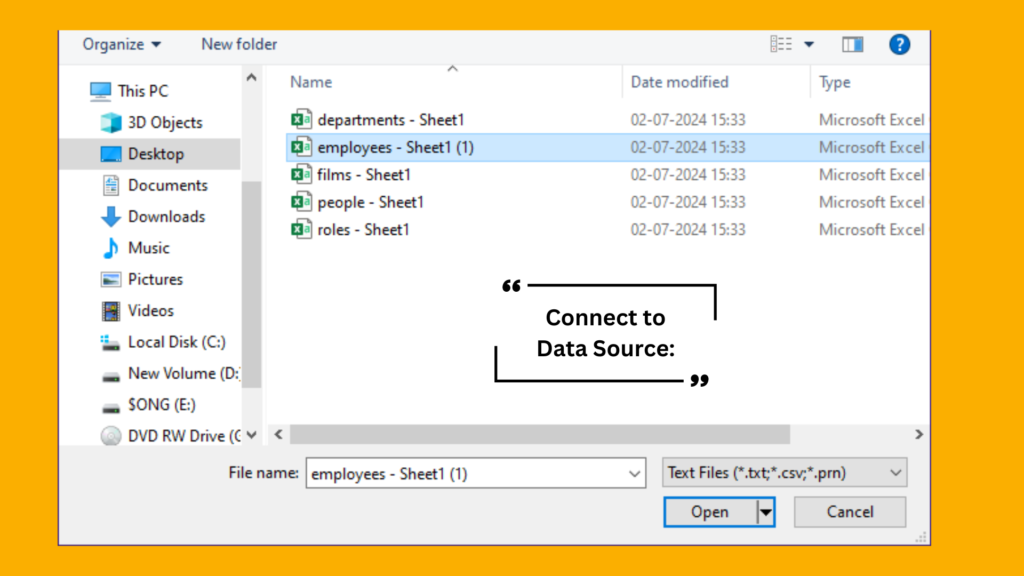
3. Select your data source and follow the prompts to load the data.
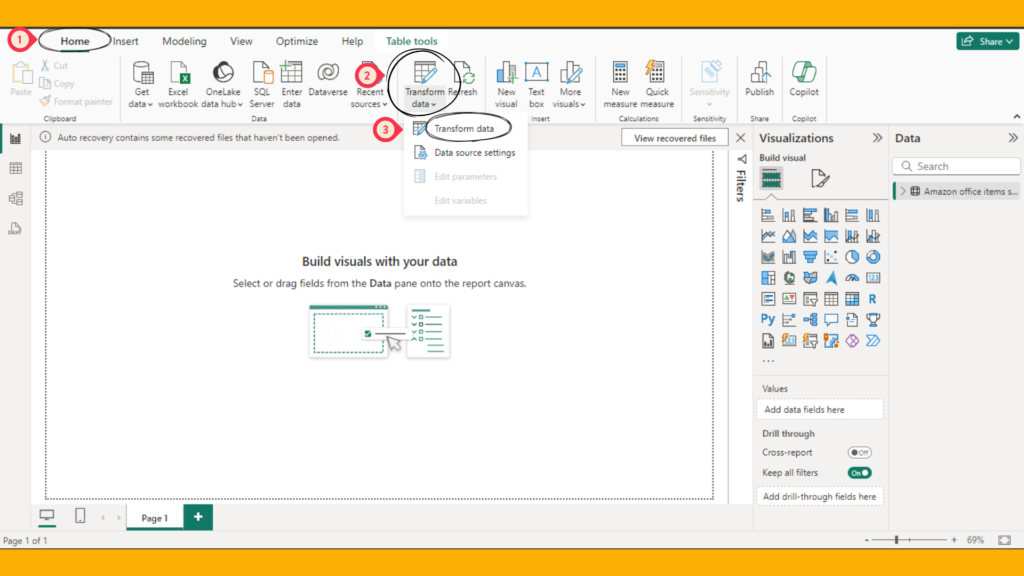
2. Opening the Power Query Editor
Once your data is loaded, access the Power Query Editor to start creating new columns.
- In Power BI Desktop, navigate to the Home tab.
- Click on Transform Data to open the Power Query Editor.
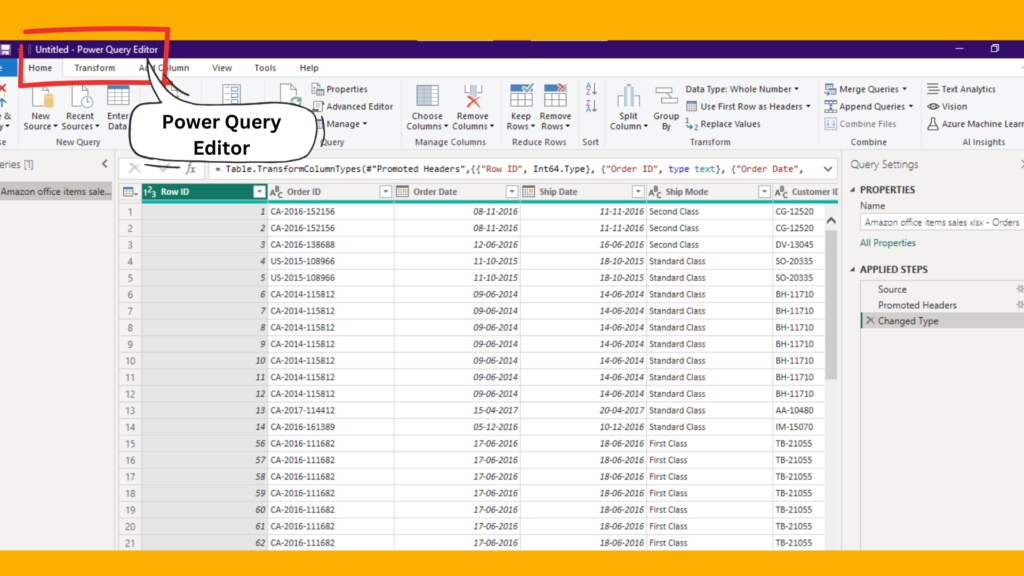
3. Grouping Data in Power Query Editor
In the Power Query Editor, you can group data using various techniques and options.
Example 1: Grouping Sales Data by Month
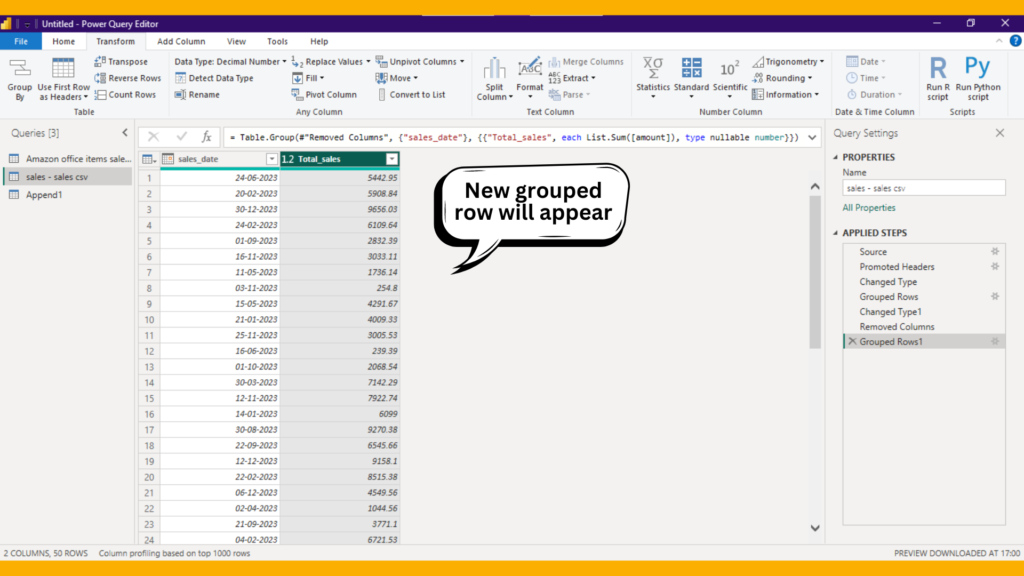
Suppose you have a sales dataset with columns Date and SalesAmount. You want to group the data by month and calculate the total sales for each month.
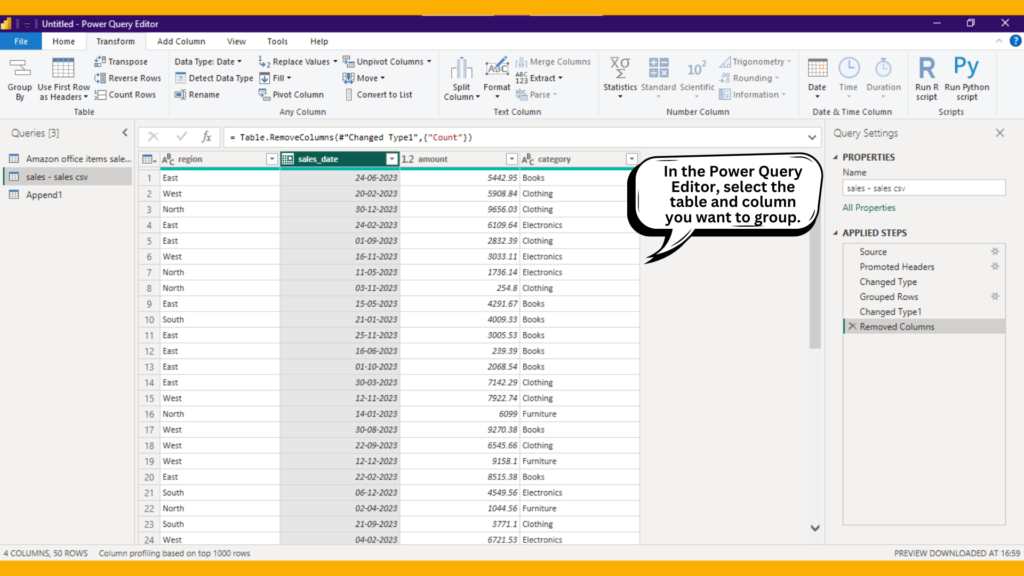
- In the Power Query Editor, select the table you want to group.
- Go to the Transform tab.
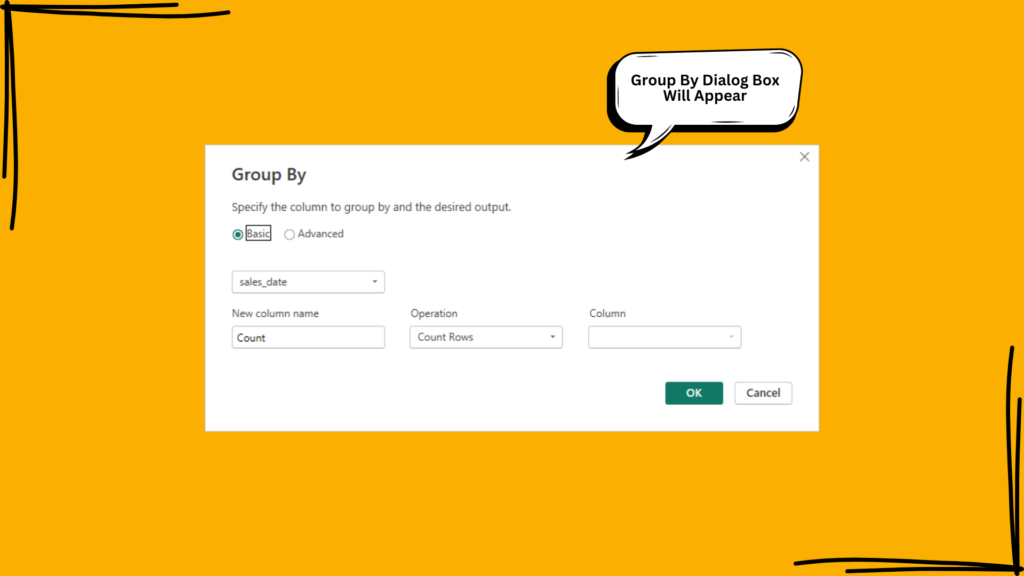
- Click on Group By.
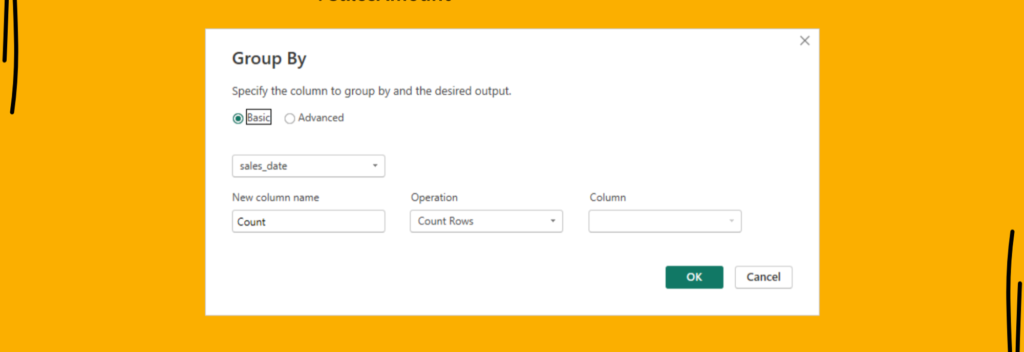
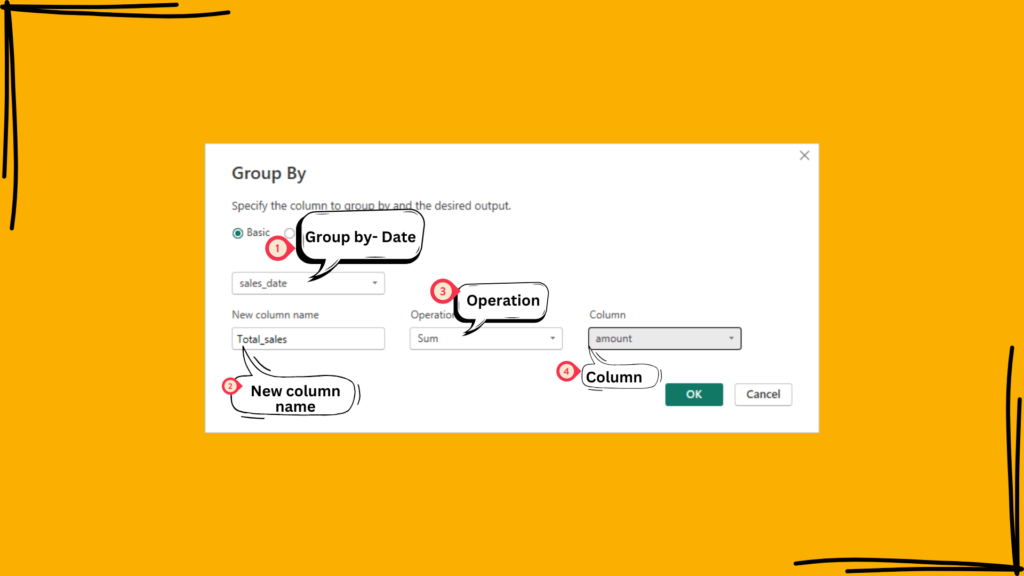
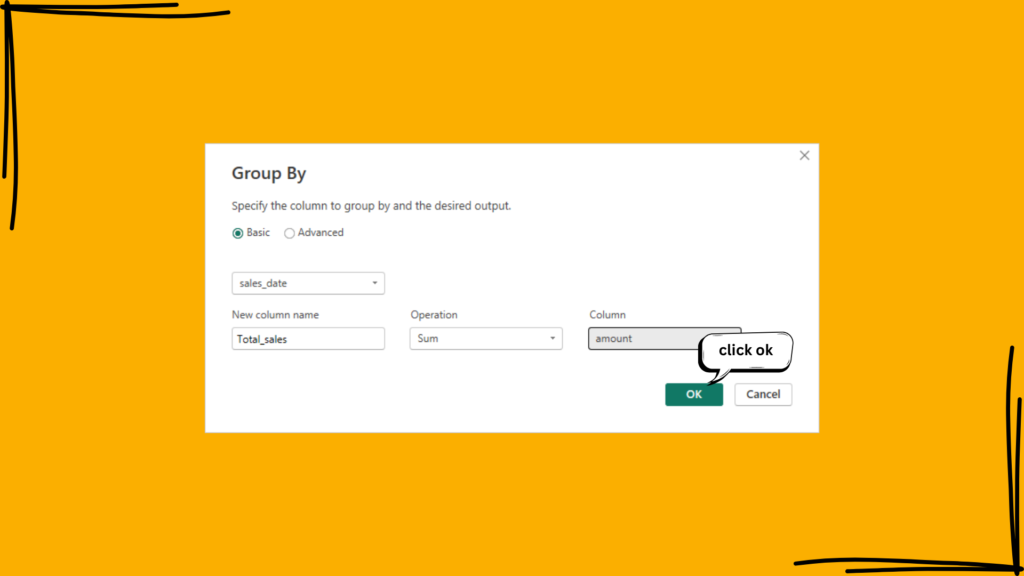
- In the Group By dialog box:
- Group by: Date (choose to group by Month)
- New column name: TotalSales
- Operation: Sum
- Column: SalesAmount
4. Grouping Data by Multiple Columns
You can also group data by multiple columns to create more detailed summaries.
Example 2: Grouping Sales Data by Month and Product
Assume you have a sales dataset with columns Date, Product, and SalesAmount. You want to group the data by month and product, and calculate the total sales for each combination.
- In the Power Query Editor, select the table you want to group.
- Go to the Transform tab.
- Click on Group By.
- In the Group By dialog box:
- Group by: Date (choose to group by Month) and Product
- New column name: TotalSales
- Operation: Sum
- Column: SalesAmount
5. Performing Multiple Aggregations
You can perform multiple aggregations when grouping data, such as calculating the sum, average, and count simultaneously.
Example 3: Multiple Aggregations for Sales Data
Assume you have a sales dataset with columns Date and SalesAmount. You want to group the data by month and calculate the total sales, average sales, and count of sales records.
- In the Power Query Editor, select the table you want to group.
- Go to the Transform tab.
- Click on Group By.
- In the Group By dialog box:
- Group by: Date (choose to group by Month)
- New column name: TotalSales
- Operation: Sum
- Column: SalesAmount
- Additional columns: Add new columns for average and count operations.
Conclusion
Grouping data in Power BI is a powerful technique for data analysts. Whether through simple grouping, grouping by multiple columns, or performing multiple aggregations, grouping data enables summarizing large datasets, identifying patterns and trends, and performing aggregate calculations, enhancing the overall data transformation process.
Frequently Asked Questions
Grouping data involves aggregating data points based on a common field, whereas summarizing data refers to performing calculations such as sum, average, and count. Grouping is a technique used to summarize data.
Yes, you can group data by custom categories by creating a new column with the desired categories before performing the grouping operation.
If you encounter errors when grouping data, check the following:
Ensure all referenced columns exist and have the correct data types.
Validate your grouping and aggregation steps for syntax errors.
Use the Error and Query Dependencies views in the Power Query Editor to identify and resolve issues.
